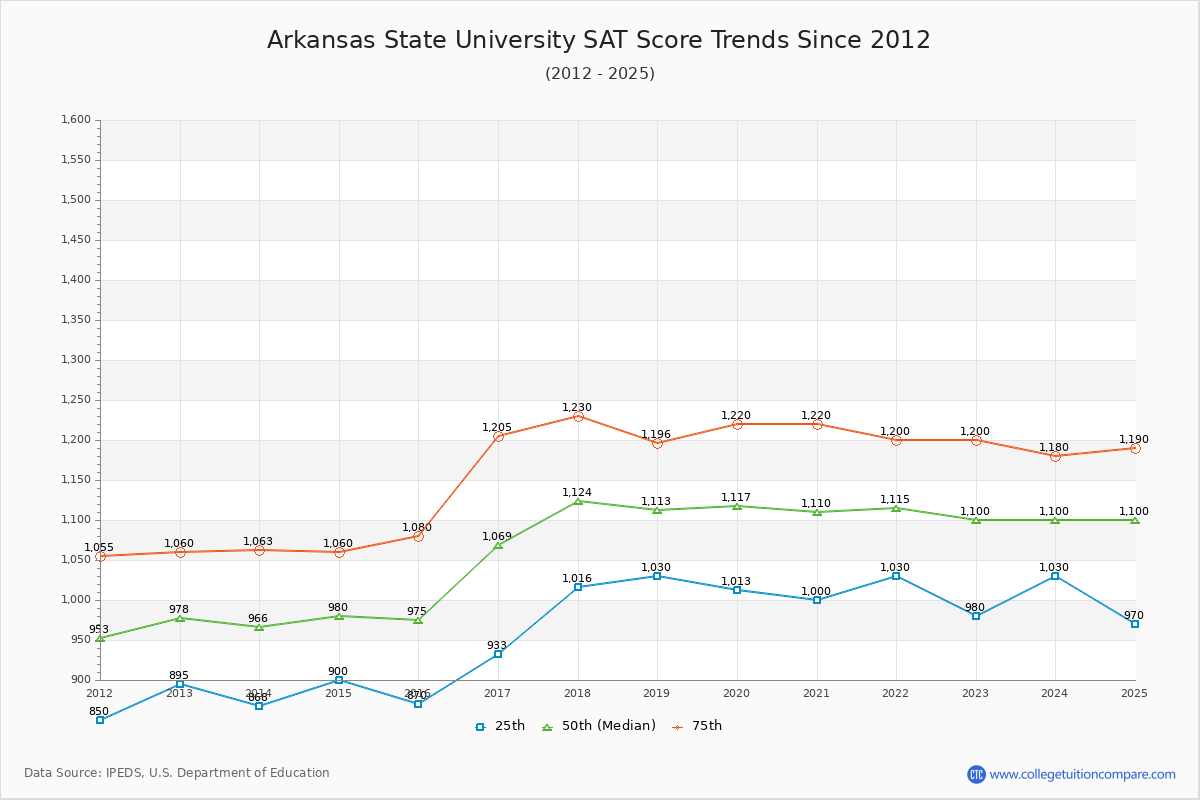
The SAT score have been increased 134.5 points since 2013 and the SAT score went up and down almost every year at Arkansas State. Compared to similar schools, the submitted SAT and ACT scores are around national average at Arkansas State.
You can check and compare colleges with similar SAT scores Arkansas State by SAT score range 1000-1100, 1050-1150, and 1100-1200.
The 2024 SAT score is 1100 at Arkansas State. Over the past 12 years, the average SAT score is 970 (25 th percentile) and 1169 (75 th percentile). Compared to similar schools, the submitted SAT scores are around national average at Arkansas State.
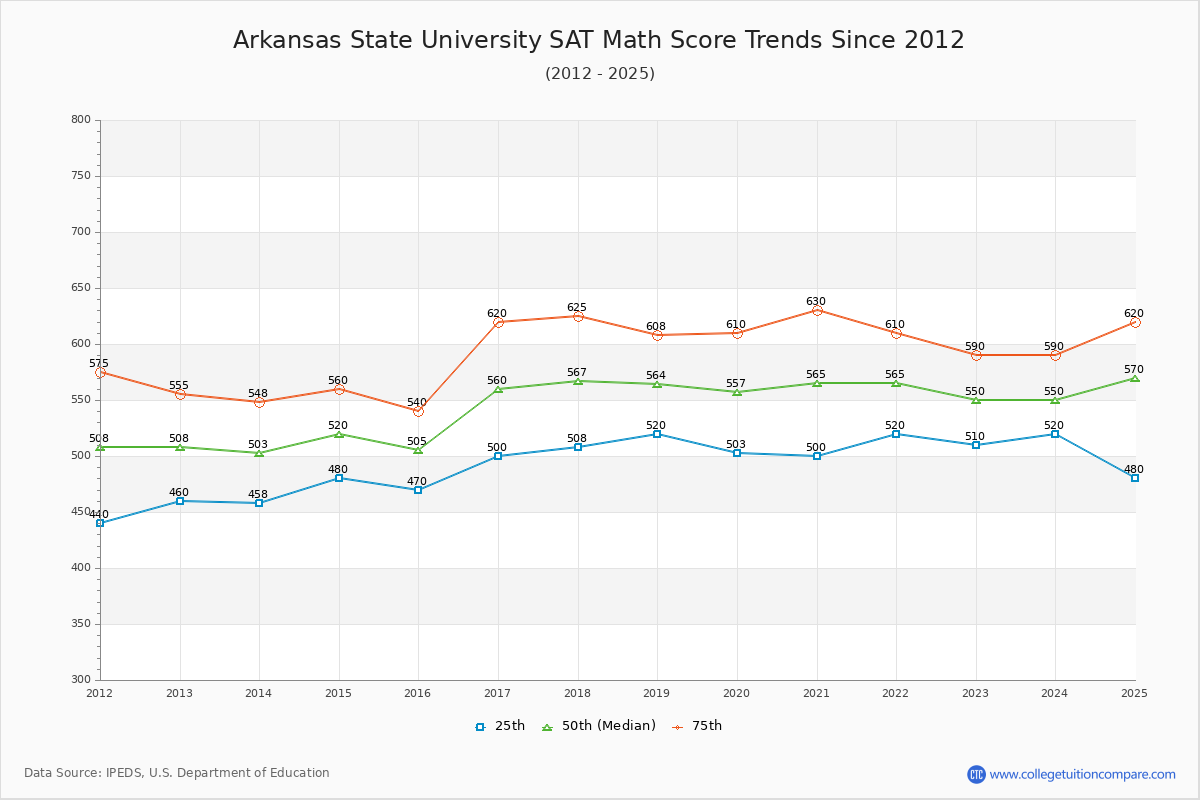
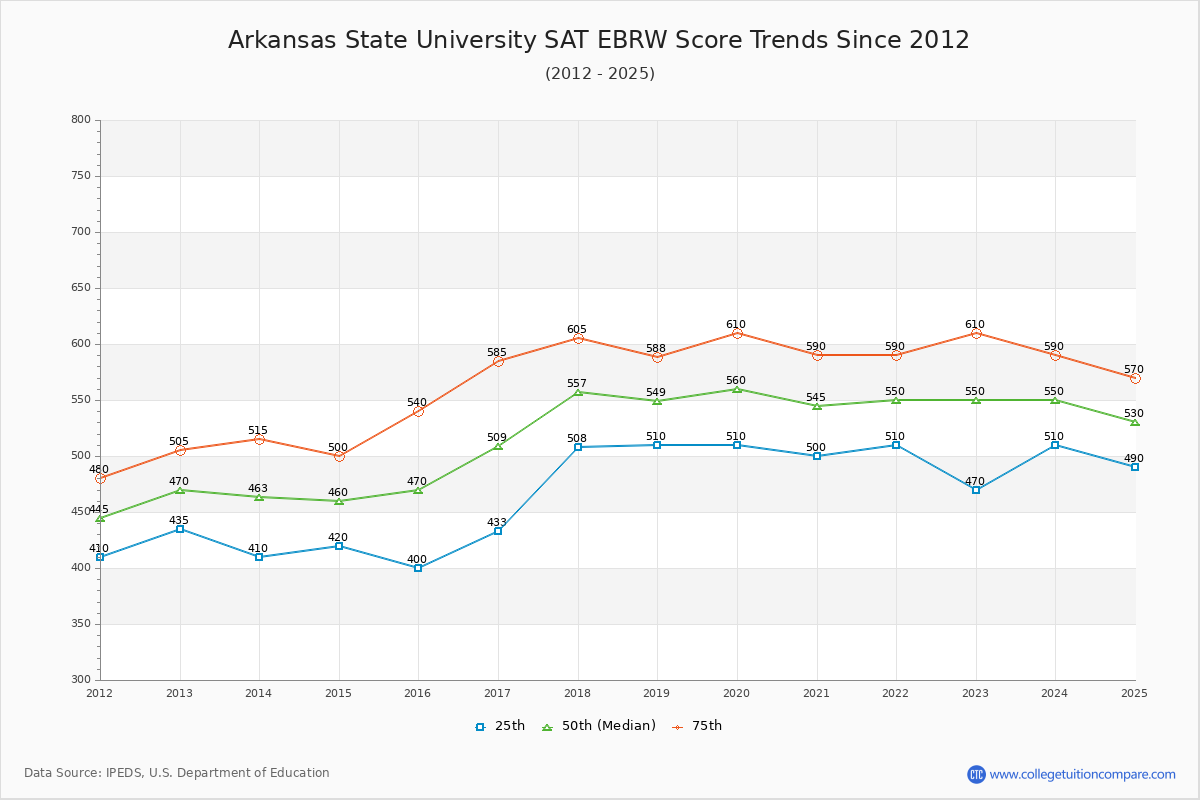
The following table and chart illustrate the changes in SAT scores at Arkansas State University since 2013.
| Year | Total | Math | Evidence-Based Reading and Writing | ||||||
|---|---|---|---|---|---|---|---|---|---|
| 25 th | 50 th | 75 th | 25 th | 50 th | 75 th | 25 th | 50 th | 75 th | |
| 2013-14 | 868 | 966 | 1,063 | 458 | 503 | 548 | 410 | 463 | 515 |
| 2014-15 | 900 | 980 | 1,060 | 480 | 520 | 560 | 420 | 460 | 500 |
| 2015-16 | 870 | 975 | 1,080 | 470 | 505 | 540 | 400 | 470 | 540 |
| 2016-17 | 933 | 1,069 | 1,205 | 500 | 560 | 620 | 433 | 509 | 585 |
| 2017-18 | 1,016 | 1,123 | 1,230 | 508 | 567 | 625 | 508 | 557 | 605 |
| 2018-19 | 1,030 | 1,113 | 1,196 | 520 | 564 | 608 | 510 | 549 | 588 |
| 2019-20 | 1,013 | 1,117 | 1,220 | 503 | 557 | 610 | 510 | 560 | 610 |
| 2020-21 | 1,000 | 1,110 | 1,220 | 500 | 565 | 630 | 500 | 545 | 590 |
| 2021-22 | 1,030 | 1,115 | 1,200 | 520 | 565 | 610 | 510 | 550 | 590 |
| 2022-23 | 980 | 1,100 | 1,200 | 510 | 550 | 590 | 470 | 550 | 610 |
| 2023-24 | 1,030 | 1,100 | 1,180 | 520 | 550 | 590 | 510 | 550 | 590 |
| Average | 970 | 1070 | 1169 | 499 | 546 | 594 | 471 | 524 | 575 |
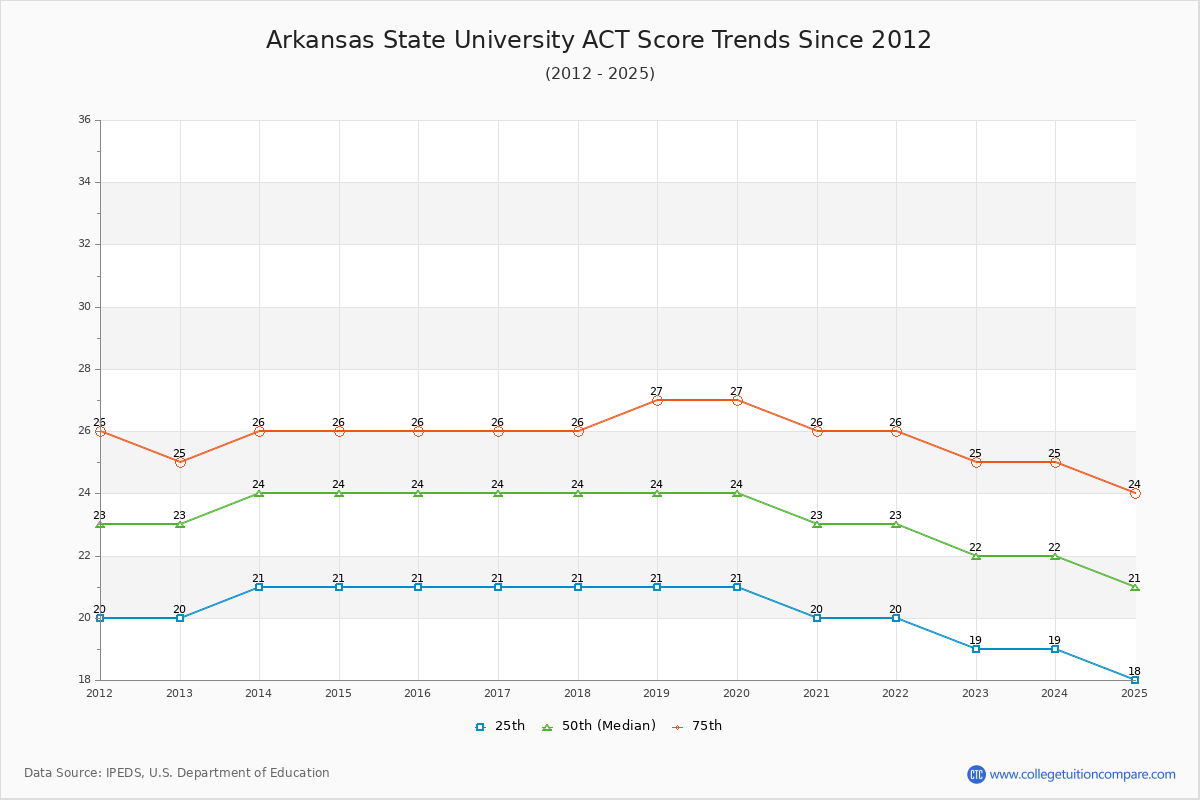
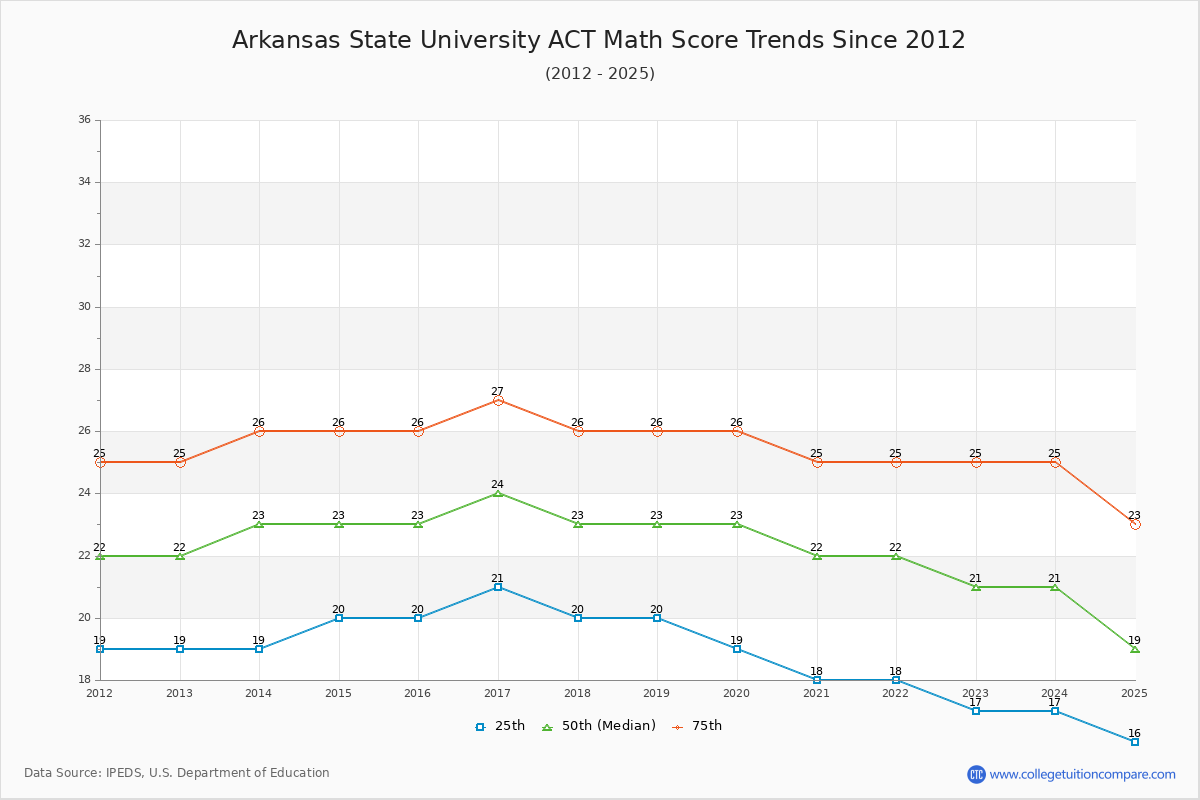
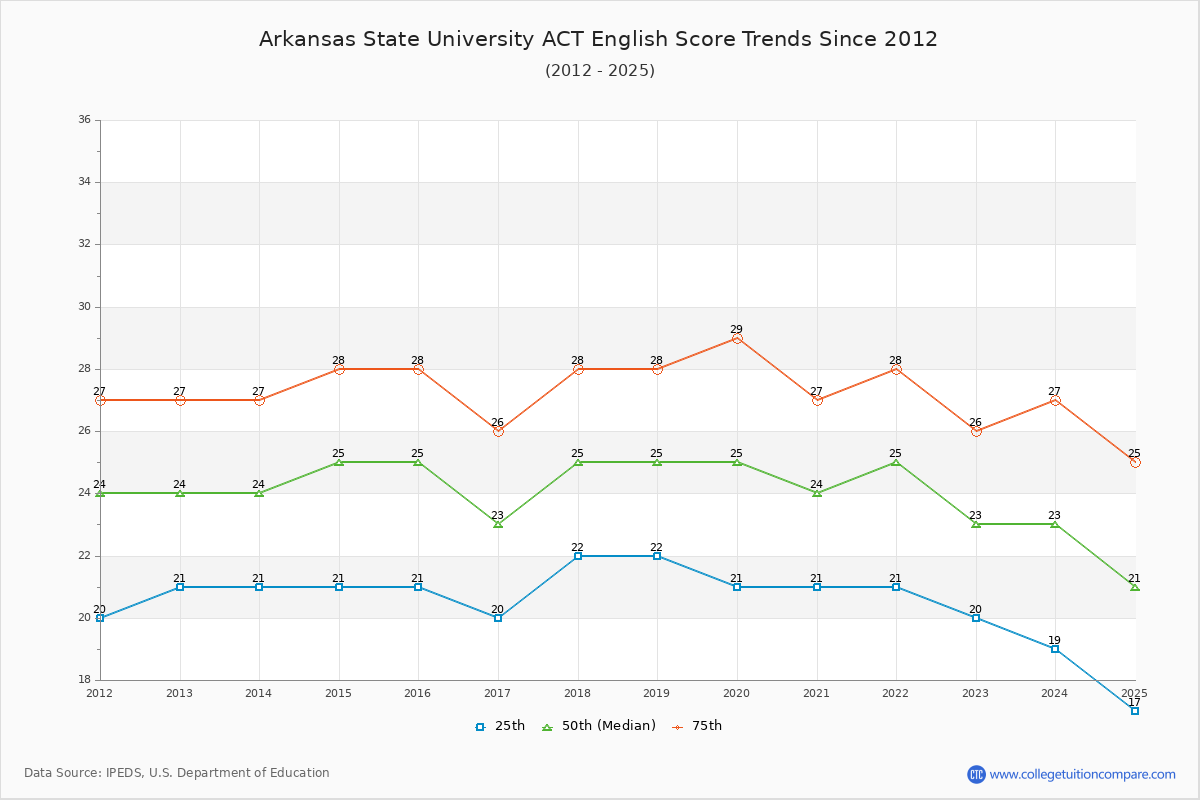
The 2024 ACT score is 22 at Arkansas State. Over the past 12 years, the average ACT score of the last 12 years is 20 (25 th percentile) and 26 (75 th percentile). Compared to similar schools, the submitted ACT scores are around national average at Arkansas State.
The following table and chart show the changes in ACT scores at Arkansas State University since 2013.
| Year | Composite | English | Math | ||||||
|---|---|---|---|---|---|---|---|---|---|
| 25 th | 50 th | 75 th | 25 th | 50 th | 75 th | 25 th | 50 th | 75 th | |
| 2013-14 | 21 | 24 | 26 | 21 | 24 | 27 | 19 | 23 | 26 |
| 2014-15 | 21 | 24 | 26 | 21 | 25 | 28 | 20 | 23 | 26 |
| 2015-16 | 21 | 24 | 26 | 21 | 25 | 28 | 20 | 23 | 26 |
| 2016-17 | 21 | 24 | 26 | 20 | 23 | 26 | 21 | 24 | 27 |
| 2017-18 | 21 | 24 | 26 | 22 | 25 | 28 | 20 | 23 | 26 |
| 2018-19 | 21 | 24 | 27 | 22 | 25 | 28 | 20 | 23 | 26 |
| 2019-20 | 21 | 24 | 27 | 21 | 25 | 29 | 19 | 23 | 26 |
| 2020-21 | 20 | 23 | 26 | 21 | 24 | 27 | 18 | 22 | 25 |
| 2021-22 | 20 | 23 | 26 | 21 | 25 | 28 | 18 | 22 | 25 |
| 2022-23 | 19 | 22 | 25 | 20 | 23 | 26 | 17 | 21 | 25 |
| 2023-24 | 19 | 22 | 25 | 19 | 23 | 27 | 17 | 21 | 25 |
| Average | 20 | 23 | 26 | 21 | 24 | 27 | 19 | 22 | 26 |
The following table compares SAT score changes from last year between Arkansas State University and similar schools.
| 2024 | 2023 | Change % | |
|---|---|---|---|
| Arkansas State University | 1100 | 1115 | -1.35% |
| University of Louisiana at Monroe | 1200 | 1165 | 3.00% |
| University of Arkansas at Little Rock | 1080 | 1100 | -1.82% |
| Georgia Southern University | 1060 | 1095 | -3.20% |
| University of South Alabama | 1095 | 1100 | -0.45% |
| Texas State University | 1080 | 1085 | -0.46% |
Share your experiences and thoughts about Arkansas State University. It will be a great help to applicants and prospective students!